Reveal novel protein constituents in user-defined subcellular regions in tissues or cells with the Microscoop® platform.
Microscoop® Mint uses microscopy-guided photo-biotinylation to enable superior resolution, specificity, sensitivity, and efficiency.
A uniquely advanced solution to prep for mass spec analysis, the platform’s capabilities and streamlined workflows offers advantages over traditional methods like laser capture microdissection (LCM), antibody-based imaging workflows, and proximity labeling.
Highlights
Explore cellular and subcellular interactions that shape health and disease like never before.
Unbiased discovery
Extract all proteomic information without antibodies or targeted panels across an entire sample.
High resolution
350 nm precision at sub-cellular scale.
Broad sample compatibility
Use with FFPE/fresh frozen tissue samples or fixed cells.
Identify targets faster
Discover novel biomarkers or therapeutic targets of disease-associated locations.
Superior sensitivity
Discover low copy number proteins from increased dynamic range due to subcellular protein isolation.
Reveal
novel proteomes of organelles, cells and organisms.
Unmatched specificity
Two photon guided photo-biotinylation identifies only proteins in regions of interest.
Maximize the value and impact of your mass spec data
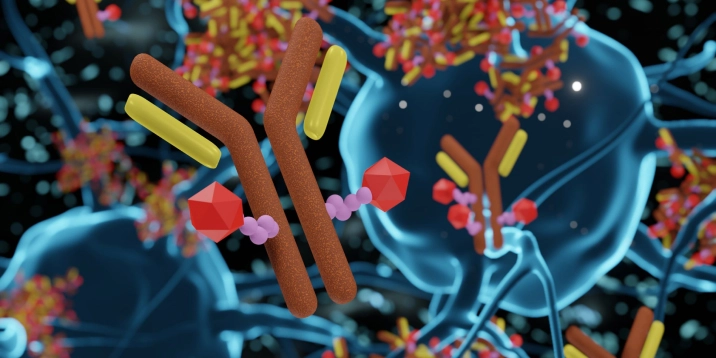
Traditional proteomic technology often relies on predefined panels or antibody-based enrichment, which introduces bias—only known or expected proteins are detected.
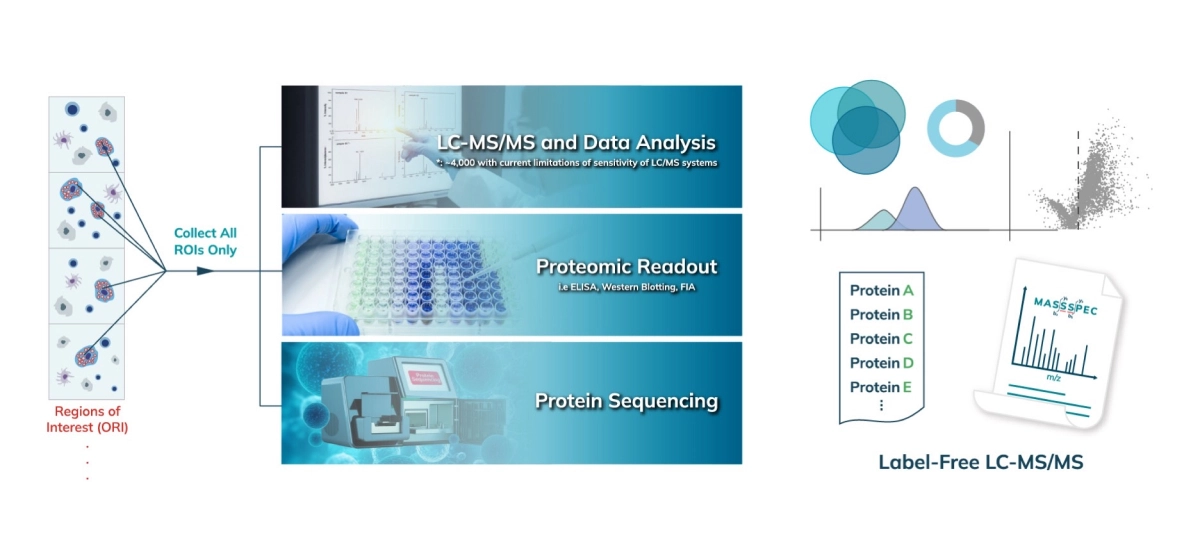
But Syncell’s Microscoop® labels and analyzes all proteins in a specific region of interest without pre-selection, allowing mass spec to capture low-abundance or rare proteoforms, and reveal otherwise unknown protein constituents with higher dynamic range and specificity than laser microdissection or proximity labeling methods.
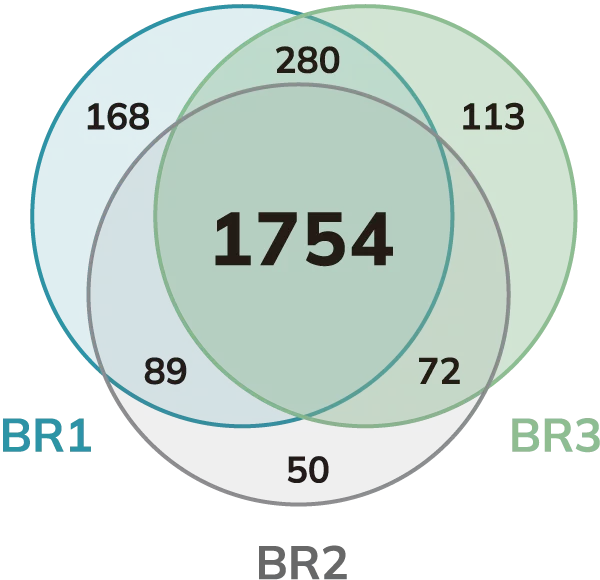
Venn diagram of the stress granule proteins spatially isolated by Microscoop® and analyzed by mass spectrometry.
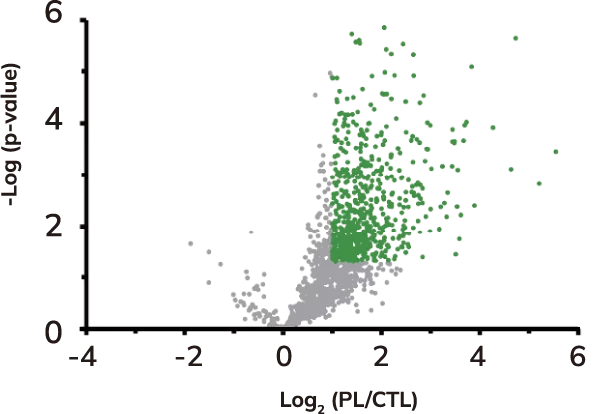
Volcano plot of protein levels in relative photolabeled (PL) samples to control (CTL) samples in log2 scale. Over-represented (enriched) proteins are shown in green.
Spatial Context
Mass spec alone doesn’t provide spatial information but combining it with the power of Syncell’s microscopy-guided photo-biotinylation technology enables researchers to link spatial location with the entire local proteome allowing you to:
understand the entire proteomic makeup of key organelles to identify novel biomarkers (e.g., cilia, nuclei, tumor microenvironments).
understand the location-function relationships of proteins.
identify disease-related signatures based on tissue architecture to hone in on the exact proteomic targets that are responsible for disease progression
High-quality Mass Spec Data
By restricting the proteomic analysis to defined cellular or subcellular regions, our proprietary opto-proteomic platform improves:
signal-to-noise in complex tissue samples
dynamic range and loses low expressing proteins in LC/MS data
and enables single-region proteomic profiling
Sample Access
Microscoop can work with FFPE/fresh frozen tissue, preserving the integrity of archived clinical samples. This brings MS-based insights into areas where methods like proximity labeling are not capable:
human samples
archived tissue
cells that are difficult for transfection
“The enrichment in the data is the best I’ve ever seen.”
Resolution Constraints: XY-resolution (~200 nm) and Z-resolution (3–20 μm) are insufficient for small, specific structures like nucleoli, stress granules, and primary cilia.
Z-Axis Limitations: Low Z-axis resolution increases non-specificity for small targets, compromising accuracy.
Throughput Challenges: Limited scalability, with a maximum of ~100 cells isolated per hour even after optimization.
Application Restrictions: Current resolution and throughput hinder use in high-precision and large-scale studies.
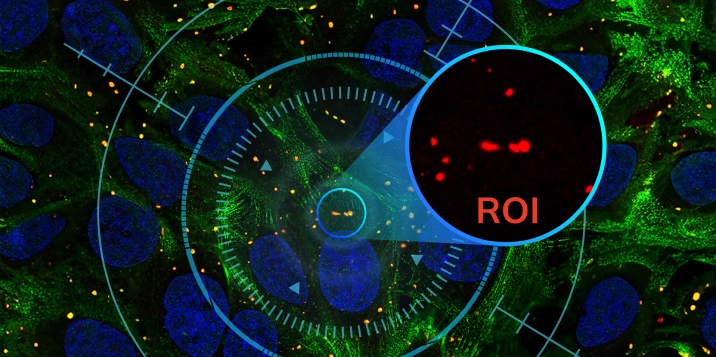
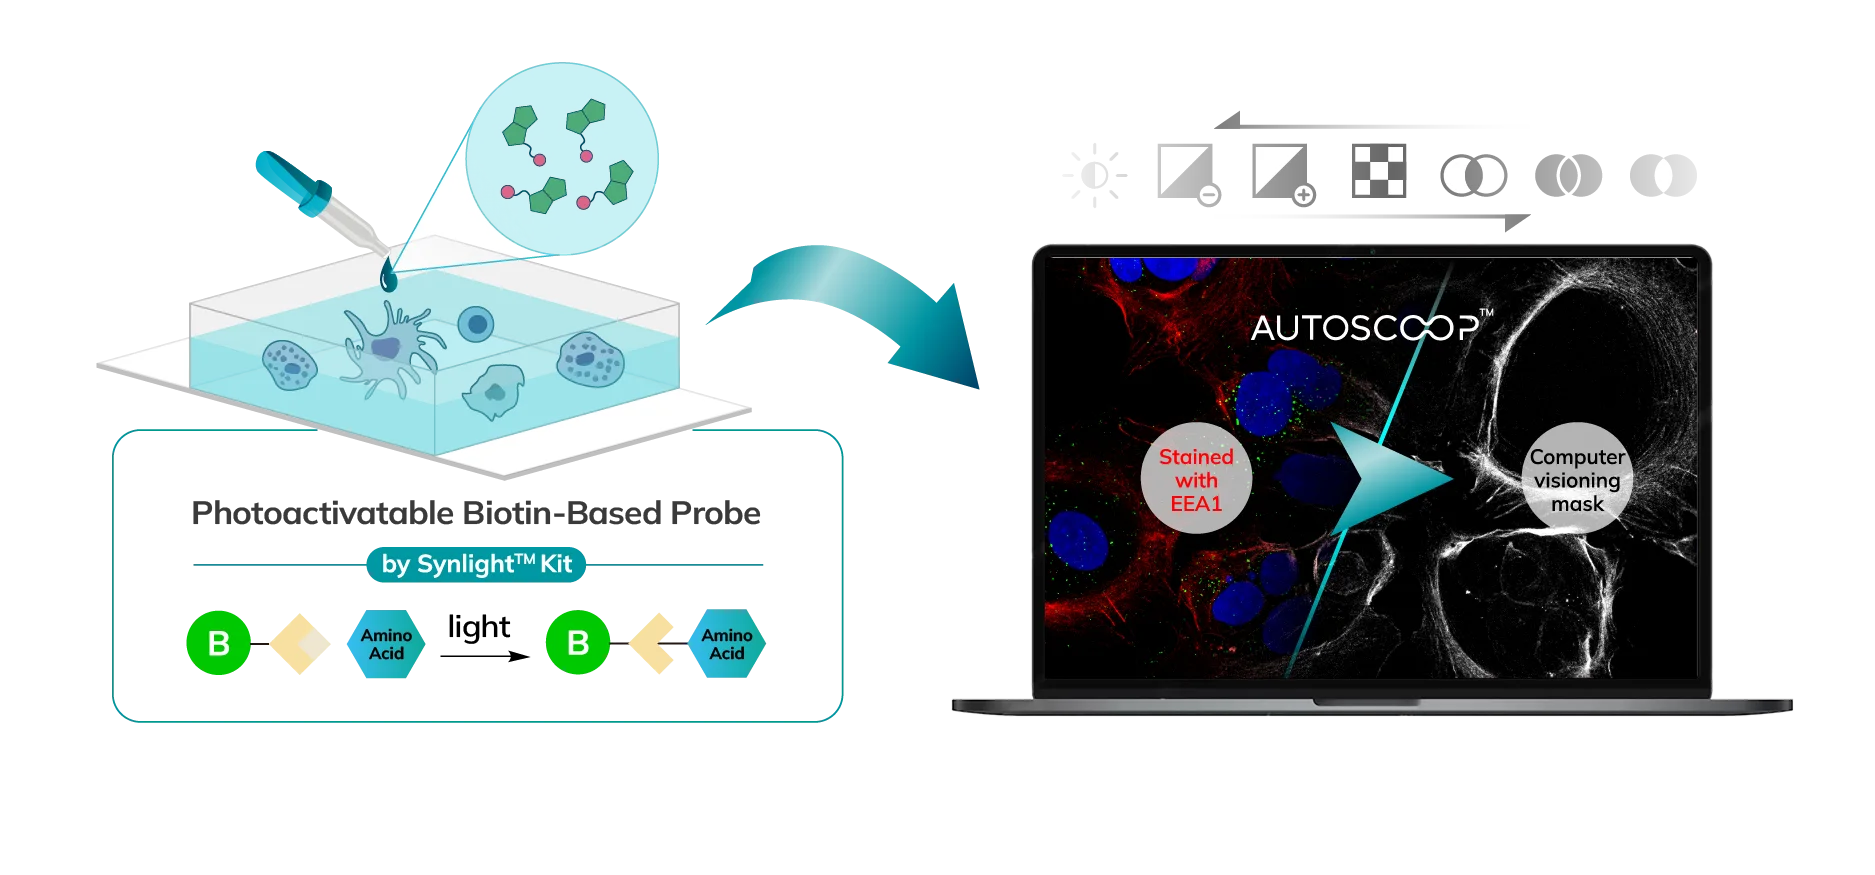
01 | Region of Interest (ROI) Selection and Image Analysis
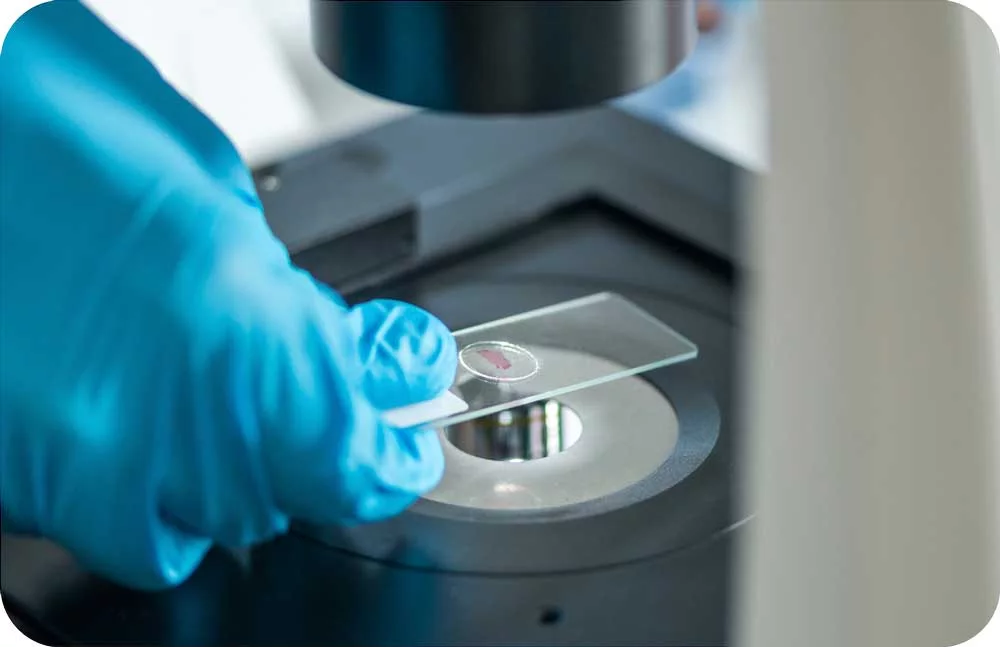
Cells (Fixed, Frozen) or Tissue (FFPE, Fresh Frozen, PFA/Methanol fixed) are stained with a marker that the researcher uses to predefine areas for deeper proteomic analysis. This can be stained with an immunofluorescent marker, multiple markers or other anatomical marker of interest that can be identified via microscopy. One can define these regions based on size, shape, location, distance, and intensity. The user places the stained sample on the Microscoop stage and the sample is imaged. These ROI’s are identified manually within one field of view (FOV) and converted by the Microscoop Autoscoop Software to an image mask, a binary parameter, that tells the system which specific locations to target for whole proteome analysis. The image mask is automatically applied to the entire sample. The ROI’s are the “blueprint” by which the 2-photon laser uses in the next step to target the specific locations of interest.
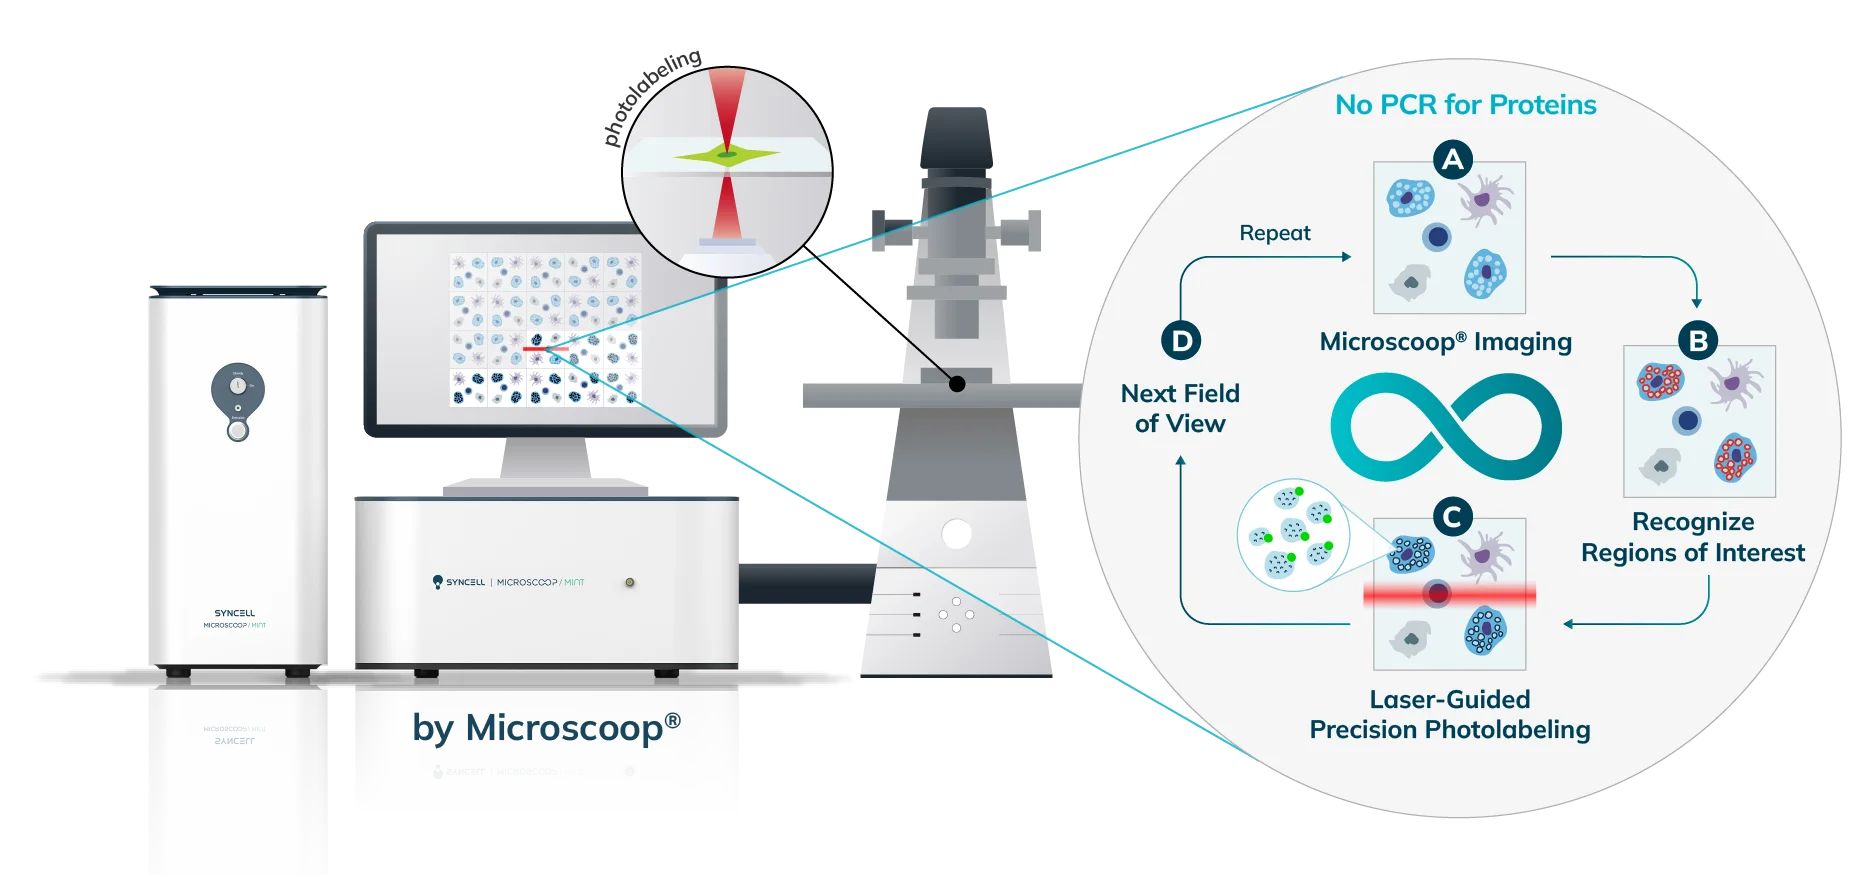
02 | Patterned Photo-Biotinylation
The Synlight Rich kit, containing a photobiotinylation reagent, is applied to the entire sample. A femtosecond light source is controlled mechatronically is used to illuminate the region of interest one pixel at a time. This patterned illumination triggers targeted protein photo-biotinlyation with high spatial precision through the reactions of light-sensitive probes of the Synlight-Rich™ Kit. This patterned photolabeling is repeated for hundreds to thousands of FOVs automatically. The number of photolabeling events is dictated by the size and quantity of the ROI’s. The intention is to aggregate all ROI protein material together to ensure there is sufficient protein to go through the protein extraction and input to downstream mass spectrometry or alternative downstream proteomic readouts. This entire step is done automatically and requires no user intervention until all pixels are labeled by the laser across the FOV’s of interest.
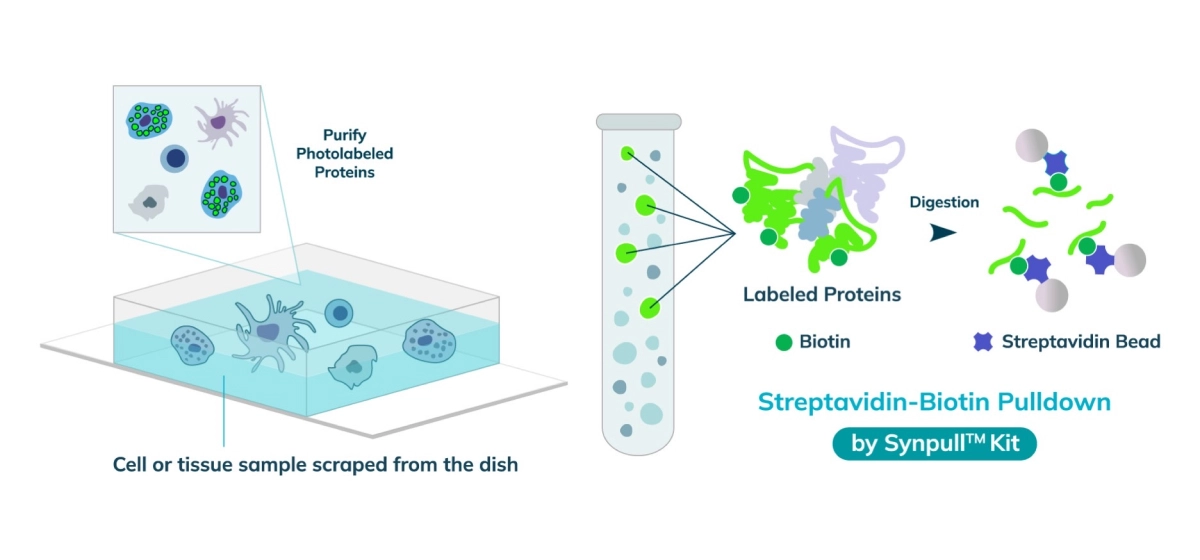
03| Protein Extraction
The entire sample contents are collected from the slide or chamber. Materials from multiple slides or chambers can be pooled together to increase the total protein content. The Synpull Kit is used to carry out the next steps of extraction. Using the kit, the samples are lysed, biotinylated proteins are enriched and purified by immunoprecipitation, and proteins digested into peptides for proteomic analysis.
04 | Proteomic Identification and Analysis
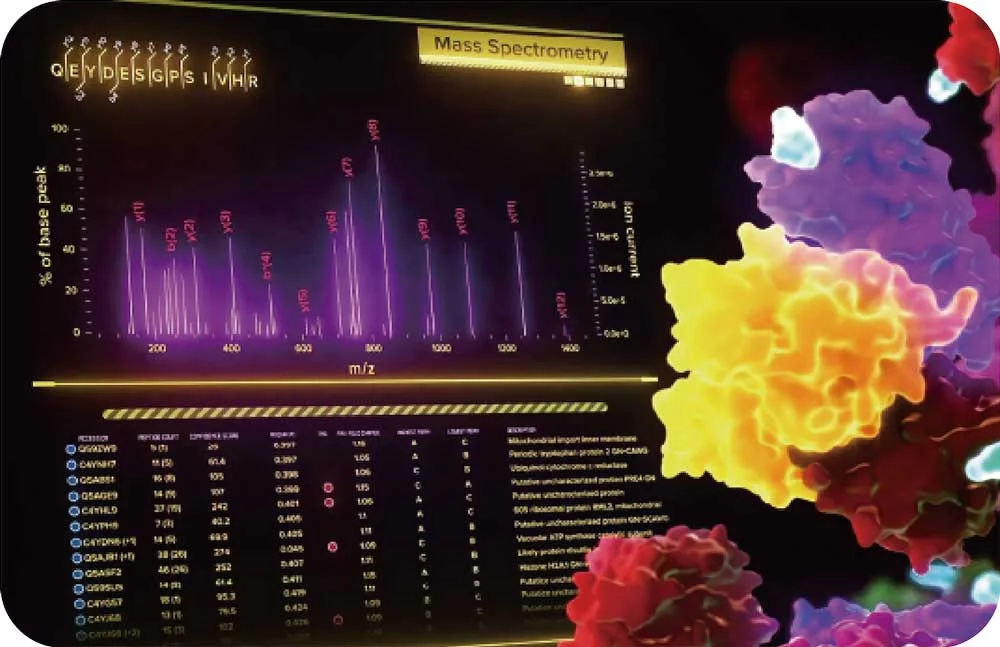
The collected peptides can be lyophilized for downstream proteomic analysis. Typically, an unbiased proteomic analysis of the protein lysate collected from the Synpull Assay is performed on a mass spectrometer (LC-MS/MS). Proteomes of both the photo-labeled and unlabeled (control) samples are obtained. By comparing the proteomic makeup of the control and photolabeled samples, a location-specific proteome is obtained with high sensitivity and, high specificity with high spatial precision. Validation can be done by colocalization of immunostaining, subsequent follow-on mass spec experiments or additional functional assays. Unique analyses like differential protein expression, treatment/control, disease/normal, and post translational modifications can also be carried out with the output of the Microscoop.
Product Specifications
Syncell’s hardware-firmware-software integrated mechatronic system enables accurate and fast control of scanners, lasers, microscope, camera, epi-illumination light source and peripheral devices.
Microscoop system (optical engine and electrical controller)
Inverted epifluorescence microscope
Filter sets for microscope
Epifluorescence illumination light source
Two-photon laser for Microscoop® photolabeling
Camera
Software package
Dimensions (L x W x H)
Electrical controller: 44 cm x 22 cm x 47 cm
Optical engine: 68 cm x 46 cm x 22 cm
Pattern Segmentation Options
Toolbox for traditional image processing
Trained model using Al deep leaming
Imagery Wavelength
Dyes: e.g. DAPI, FITC, Cy3, Сy5
Fluorescent proteins: e.g. EBFP2, EGFP, DsRed/mCherry
Objectives
10x (up to NA 0.45)
20x (up to NA 0.80)
40x (up to NA 0.95)
Validated on multiple, easily accessible, LC/MS instruments